KenPom is one of the most influential analytics systems in college basketball. Created by Ken Pomeroy, it ranks teams based on efficiency rather than wins and losses. For NCAAB bettors, that distinction is critical.
Traditional standings tell you who won. KenPom tells you how well they actually played.
Because betting markets price games based on projected efficiency and scoring margin, understanding KenPom ratings can improve how you evaluate spreads, totals, and tournament matchups.
However, like any metric, it must be used correctly.
What Is KenPom?
KenPom refers to the advanced analytics system published at KenPom.com, widely cited by analysts, broadcasters, and bettors.
The model evaluates teams primarily through:
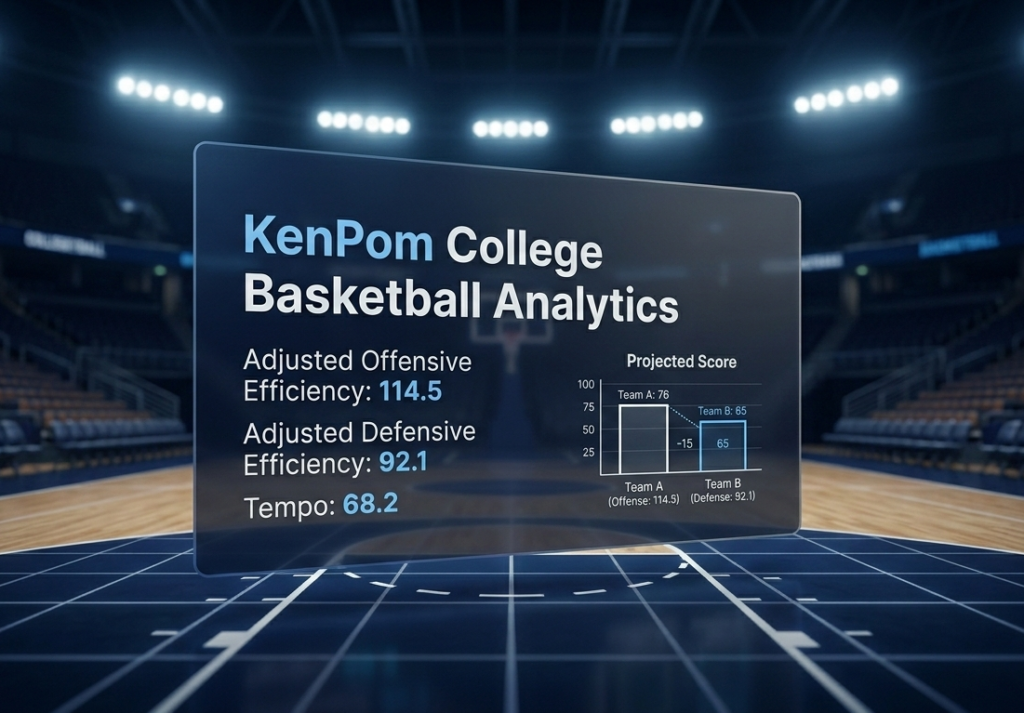
• Adjusted Offensive Efficiency
• Adjusted Defensive Efficiency
• Tempo
• Strength of Schedule
• Opponent Adjustments
Instead of measuring raw points per game, KenPom calculates how many points a team scores or allows per 100 possessions, adjusted for opponent quality.
According to historical analysis cited by Sports Reference College Basketball, efficiency based metrics are more predictive of future results than raw scoring totals.
That is why KenPom became central to modern NCAAB analysis.
Why Efficiency Matters More Than Points Per Game
College basketball varies widely in tempo. Some teams play fast and score 80 points per game. Others play slow and score 65.
Without adjusting for pace, raw scoring numbers mislead.
For example:
• Team A averages 78 points per game at a high tempo
• Team B averages 70 points per game at a slow tempo
However, per possession efficiency may reveal Team B is actually more effective offensively.
KenPom removes tempo distortion by focusing on points per 100 possessions.
If you want deeper context on tempo influence, review How Pace of Play Affects Totals Betting.
Adjusted Offensive and Defensive Efficiency
KenPom’s core metrics are adjusted for opponent strength.
Adjusted Offensive Efficiency measures how many points a team scores per 100 possessions against average competition.
Adjusted Defensive Efficiency measures how many points they allow per 100 possessions.
These adjustments matter because a team dominating weak opponents may appear stronger than they actually are.
For bettors, this provides clearer team quality assessment.
KenPom and Point Spread Evaluation
Point spreads reflect projected scoring margin.
KenPom generates predicted final scores using adjusted efficiency and tempo projections. While sportsbooks do not copy KenPom directly, they incorporate similar efficiency based modeling into power ratings.
If KenPom projections differ significantly from the market spread, that may signal potential value.
However, projection difference alone does not guarantee edge. You must compare implied probability to realistic win probability.
If you need a refresher on that concept, review What Is Expected Value and Why It Matters in Betting?
KenPom and Totals Betting
Totals in NCAAB depend heavily on tempo and efficiency.
KenPom includes tempo projections, which estimate expected possession count. When two fast teams with strong offensive efficiency meet, projected totals increase.
Conversely, two slow paced defensive teams may suppress scoring even if raw season averages appear moderate.
Structured scoring models such as https://www.theover.ai/ emphasize tempo and efficiency when projecting totals. While TheOver.ai focuses primarily on football totals, the underlying logic mirrors efficiency driven modeling principles found in KenPom.
Volume and efficiency together determine scoring probability.
How KenPom Helps During March Madness
KenPom becomes especially popular during the NCAA tournament.
Because tournament matchups often involve unfamiliar opponents, efficiency metrics provide neutral ground comparison.
For example:
• A mid major team may have strong adjusted efficiency despite weaker conference reputation
• A power conference team may have inflated record due to strength of schedule
KenPom helps normalize evaluation across conferences.
However, small sample tournament games introduce variance. Efficiency still matters, but single elimination increases unpredictability.
If you want to understand volatility in betting, review What Is Variance and How Does It Affect Bettors?
Limitations of KenPom
While KenPom is powerful, it is not perfect.
Common limitations include:
• Injuries not fully reflected immediately
• Late season roster changes
• Matchup specific style conflicts
• End of game fouling distortion
Additionally, KenPom is descriptive and predictive based on past performance. It does not account for every situational factor.
Therefore, it should be combined with contextual analysis.
How Sportsbooks Use Similar Metrics
Modern sportsbooks rely heavily on possession based modeling for college basketball. Efficiency ratings, opponent adjustments, and tempo projections shape opening spreads.
Therefore, KenPom is not secret information.
However, markets can overreact to recent box score results or conference narratives. When efficiency metrics contradict perception, small edges may appear.
Understanding market pricing is essential. For deeper insight, see What Is Market Efficiency in Sports Betting?
Common Mistakes Bettors Make With KenPom
Many bettors misuse advanced ratings. Common errors include:
• Blindly betting projection differences
• Ignoring matchup specific stylistic clashes
• Overreacting to small recent efficiency changes
• Treating KenPom as a guarantee
KenPom refines probability. It does not eliminate uncertainty.
Final Thoughts
KenPom is an advanced college basketball analytics system built around adjusted efficiency and tempo. For NCAAB bettors, it offers a clearer view of team quality than raw points per game or win loss records.
Because betting markets are driven by projected scoring margin and efficiency, KenPom helps sharpen evaluation of spreads and totals.
However, it must be used alongside matchup analysis, injury reports, and probability comparison.
Efficiency influences scoring. Scoring influences margin. Margin influences price. Price determines value.