A betting odds board is not just a list of numbers. It is a live probability market.
Every spread, moneyline, and total reflects:
• A projected outcome
• Implied probability
• Sportsbook margin
• Market sentiment
If you learn how to interpret each column properly, the board becomes a decision-making tool instead of visual noise.
Let’s break it down structurally.
1. Anatomy of a Betting Odds Board
A standard odds board contains five core elements:
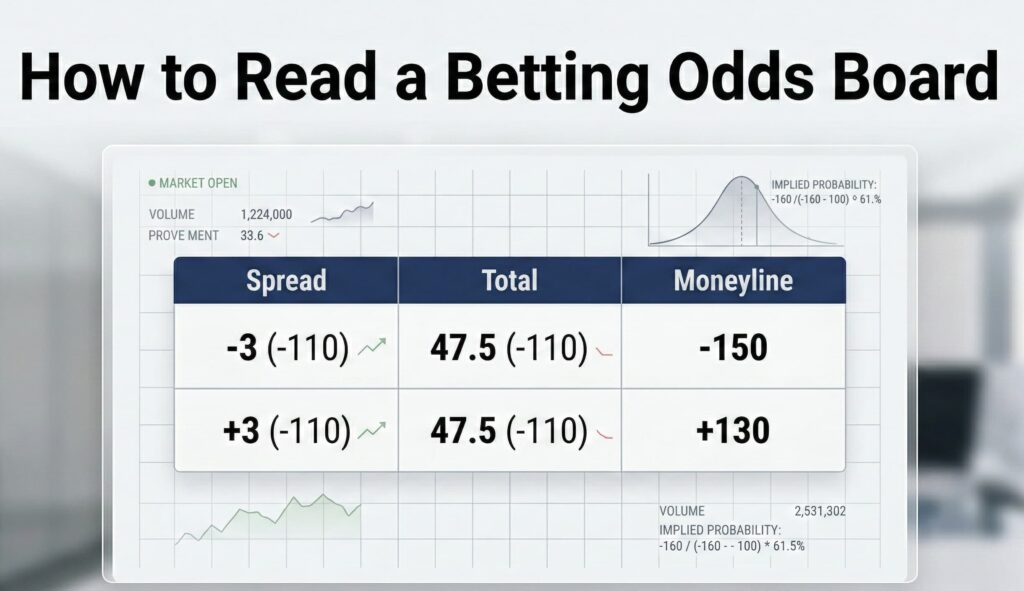
| Rotation | Team | Spread | Total | Moneyline |
|---|---|---|---|---|
| 451 | Chiefs | -3 (-110) | 47.5 (-110) | -150 |
| 452 | Raiders | +3 (-110) | 47.5 (-110) | +130 |
Each column communicates something different.
Let’s decode them.
2. Rotation Numbers
Rotation numbers are identifiers.
• Odd number = away team
• Even number = home team
They do not affect probability. They exist to simplify bet placement, especially in retail sportsbooks.
3. Point Spread: Understanding Margin Pricing
Spread example:
Chiefs -3 (-110)
This means:
• Chiefs must win by more than 3
• You risk 110 to win 100
But here’s the deeper layer.
Implied Break-Even Probability
At -110, your break-even rate is:
110 ÷ (110 + 100) = 52.38%
That means you must win 52.38% of the time just to break even.
If your projected probability is 55%, you may have value.
If your projection is 50%, the bet is negative expected value.
For deeper understanding, see What Is Expected Value and Why It Matters in Betting.
4. Key Numbers and Spread Sensitivity
In the NFL, certain margins occur more often.
| Margin | Frequency Significance |
|---|---|
| 3 | Very High |
| 7 | Very High |
| 10 | Moderate |
Moving from -3 to -3.5 is more important than moving from -8 to -8.5.
That half point crosses a key number.
The odds board does not explain that. You must recognize it.
5. Moneyline: Pure Win Probability
Moneyline example:
Chiefs -150
Raiders +130
Let’s convert to implied probability.
For -150:
150 ÷ (150 + 100) = 60%
For +130:
100 ÷ (130 + 100) = 43.48%
Notice something important.
60% + 43.48% = 103.48%
That extra 3.48% represents sportsbook margin.
This is called vig.
See What Is Vig and How Does It Affect Odds? for deeper explanation.
6. Totals: Understanding Scoring Projection
Totals example:
Over 47.5 (-110)
Under 47.5 (-110)
The number 47.5 reflects projected combined scoring.
But totals are built from:
• Projected pace
• Offensive efficiency
• Defensive efficiency
• Weather
• Game script
Structured models like those at https://www.theover.ai/ emphasize tempo and efficiency when projecting totals. Because possession count drives scoring opportunity.
If two teams average 70 plays per game vs 58 plays per game, totals projection changes significantly.
The board shows only the final number. The reasoning sits underneath.
7. Reading Line Movement
Let’s say the board opens at:
Chiefs -3 (-110)
Later it moves to:
Chiefs -3.5 (-110)
This indicates probability shift.
Reasons could include:
• Injury update
• Sharp money
• Weather change
• Public betting imbalance
Line movement does not guarantee outcome. It signals probability adjustment.
See What Is Line Movement and Why Should Bettors Care? for full context.
8. Comparing Prices Across Books
Two sportsbooks:
| Book | Spread |
|---|---|
| A | -3 (-110) |
| B | -3 (-105) |
That 5 cent difference reduces break-even percentage.
-110 = 52.38%
-105 = 51.22%
Over hundreds of bets, that difference compounds significantly.
Professional bettors treat price as the priority, not prediction.
9. Chart: Spread vs Moneyline Decision Example
Assume your projection:
Chiefs win probability: 62%
Market:
Moneyline -150 = 60% implied
Spread -3 (-110) requires 52.38% cover rate
If your model shows:
• 62% win probability
• 54% chance to win by more than 3
Moneyline may offer stronger value because margin volatility matters.
The board shows both options. You choose based on probability comparison.
10. Common Interpretation Errors
Many bettors misread boards by:
• Assuming favorite equals safe
• Ignoring implied probability
• Betting based on team name instead of price
• Ignoring small pricing differences
• Overreacting to line movement
The odds board shows price.
It does not show edge.
Edge exists only when your probability exceeds implied probability.
For deeper clarity, review What Is an Edge in Sports Betting?
11. The Odds Board as a Market
Think of the board like a stock exchange.
Prices move based on information.
Markets incorporate:
• Public betting
• Sharp betting
• Data models
• Injury reports
• Efficiency metrics
According to market theory, prices adjust quickly when new information becomes available.
Sports betting behaves similarly.
See What Is Market Efficiency in Sports Betting? for deeper understanding.
Final Thoughts
A betting odds board is a live probability display.
Spreads reflect margin.
Moneylines reflect win probability.
Totals reflect scoring projection.
Vig reflects sportsbook margin.
However, the board does not tell you what will happen. It tells you what the market believes will happen. Your job is not to pick winners. Your job is to identify mispriced probability. Price determines value. Value determines long-term success.